


The Art of Data Interpretation
Seeing Your Product Through Multiple Lenses

Hey there, product enthusiasts and data devotees!
As your friendly neighborhood VP of Engineering at Jimdo, I'm here to chat about a topic that's close to my heart: the art of data interpretation. Buckle up, because we're about to take a journey through the looking glass of product analytics!
Correlation ≠ Causation: The Data Trap
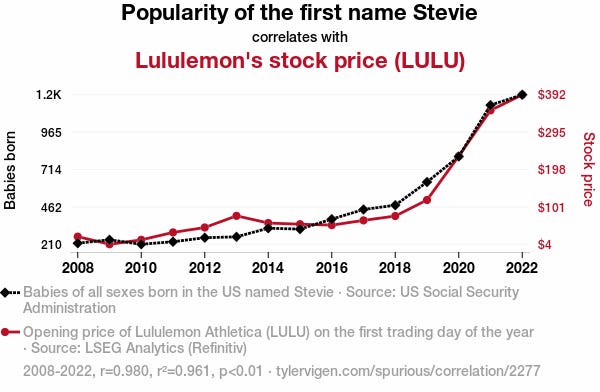
First things first: let's address the elephant in the room. We've all heard it before, but it bears repeating: correlation does not imply causation. It's easy to fall into this trap, especially when the data seems to tell such a compelling story.
To illustrate this point (and for a good laugh), check out Tyler Vigen's Spurious Correlations. You'll find gems like the striking correlation between cheese consumption and the number of people who died by becoming tangled in their bedsheets. Coincidence? I think yes!
The lesson here? Always question your assumptions and look beyond surface-level correlations.
The Multi-Lens Approach: Seeing Data in 3D
As product engineers and managers, we need to be data chameleons, constantly shifting our perspective to uncover hidden insights. Here's why:
Cognitive Biases Are Real: Our brains love patterns, sometimes to a fault. By consciously examining data from multiple angles, we can counteract biases like confirmation bias or the availability heuristic.
Context is King: Raw numbers without context are like a map without a legend. Always consider the broader picture when interpreting data.
Unexpected Insights Lurk in Shadows: Sometimes, the most valuable insights come from where you least expect them. Don't just focus on the obvious metrics.
Sometimes things resemble a square at the first glance, then you can figure out they are more complex.

The 80/20 Rule... With a Twist
We're all familiar with the Pareto Principle: 80% of effects come from 20% of causes. But let's flip this on its head when looking at product usage:
The Obvious 80%: Yes, focus on the core features that 80% of your users love. That's your bread and butter.
The Surprising 20%: Here's where it gets interesting:
Are 20% of your users getting outsized value from a less popular feature?
Is there a subset of users employing a common feature in an unexpected way?
Have users discovered an unintended use case that's providing significant value?
These "20% insights" can be gold mines for product innovation and differentiation.
Real-World Examples: Unexpected Insights Lead to Business Opportunities
Let me share an adectote that illustrate the power of looking at data from different angles:
The Unofficial Arduino Board Revelation
During my time at Arduino, we stumbled upon an unexpected data point: a significant number of users were trying to use an unsupported ESP-based board. This was surprising because we didn't officially support it. However, instead of dismissing this as irrelevant data, we dug deeper.
What we discovered was eye-opening. The number of these unofficial boards in use was actually larger than the number of official Arduino boards we supported! This insight led us to a pivotal decision: we chose to support these clone boards and make it a paid feature.
The result? This unexpected use case turned into a profitable part of our business. By looking at the data from a different perspective – focusing on what users were actually doing rather than what we thought they should be doing – we uncovered a massive opportunity that we might have otherwise missed.
These examples highlight a crucial lesson: sometimes, your users know better than you do how your product can provide value. By keeping an open mind and looking at usage data holistically, you can uncover these hidden gems of insight that can drive significant business growth.
Your Secret Sauce in a Crowded Market
Remember, in a sea of similar products, it's often the unexpected use cases or the unique way you solve a problem that sets you apart. By looking at your data through multiple lenses, you might uncover your product's secret sauce – that special something that your competitors have overlooked.
Action Items for the Data-Savvy Product Team
Regular Data Deep Dives: Schedule monthly sessions where team members present the same data set but from different perspectives.
User Interviews with Power Users: Identify those users in the "interesting 20%" and learn from their workflows.
Cross-Functional Data Analysis: Get your engineers, designers, and marketers in the same room to interpret data. The diversity of perspectives can be eye-opening.
Challenge Your Assumptions: For every data-driven conclusion, play devil's advocate. What other explanations could there be?
Remember, the goal isn't to cover 100% of use cases, but to uncover those hidden gems that could propel your product to new heights.
Wrapping Up
Data is a powerful tool, but like any tool, its value lies in how you use it. By approaching your product data with curiosity, skepticism, and multiple perspectives, you're setting yourself up to uncover insights that can truly transform your product and your market position.
Until next time, keep questioning, keep exploring, and may your data always tell interesting stories!
Ciao,
Luca
P.S. Got any interesting data interpretation stories of your own? Hit me up on LinkedIn – I'd love to hear them!